With the rising cost of electricity where I live, which is in the Northern California in the United States. I started researching about solar power for my home. While there are several Solar Power Calculators out there on the internet. I found myself creating this calculator to help me figure out how many solar panels I need and how much it’ll cost.
To figure out how many panels you need for your home. You first need to figure out what your average monthly power usage is in your electric bill. Second, you find out what your photovoltaic power potential in your area. Third, you figure out what the power output and dimensions of solar panels you are considering then plug in all the figures in the calculator below.
In this post we talk about the following:
- What is the typical power usage per month of a US Home
- What is the Photovoltaic Power Potential of your Area
- What is the typical solar panel output and dimensions
- Average Cost of Solar Systems in Each State and the Federal Solar Incentives
- Solar System Project Calculator

What is the Typical Power Usage Per Month of US Residential Dwelling
According to the US Energy Information Administration (EIA), an average American home uses about 886kWh per month.
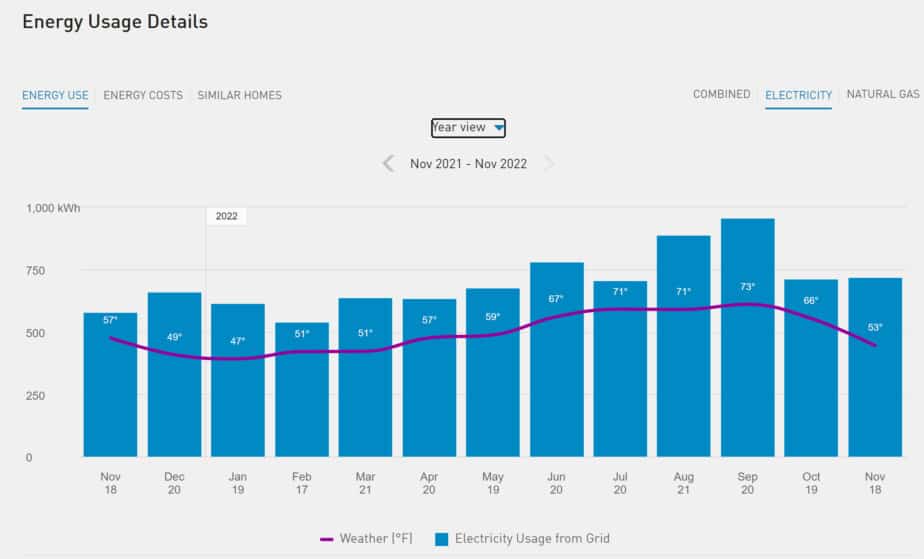
For my home, I use about 700kWh per month with a plug-in hybrid car being charged every night at around 12am till around 8am. Here’s a sample of my power usage for about year. The total for 12 months was about 8402kWh.

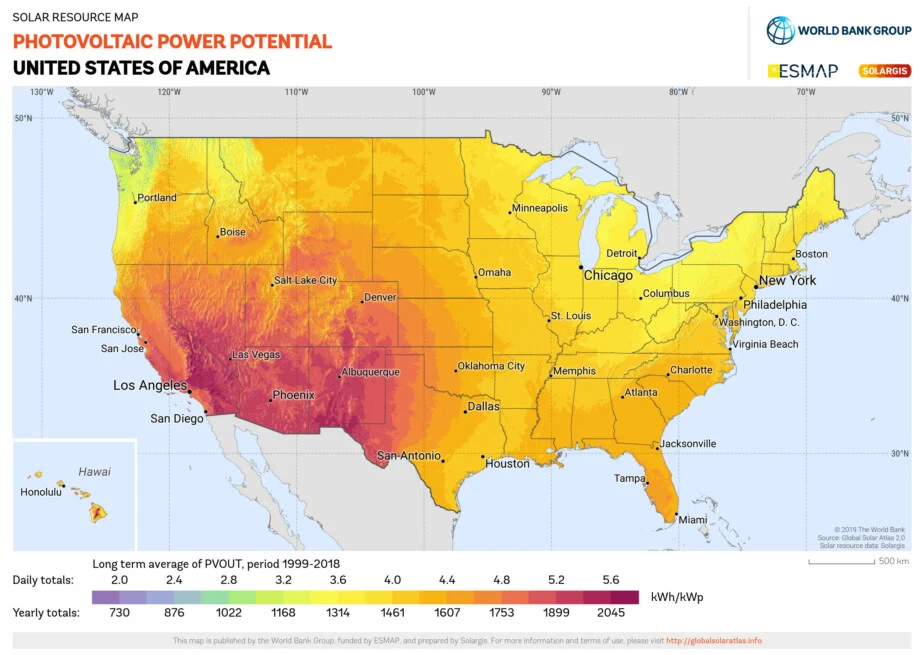
What is the Photovoltaic Power Potential in Your Area?
Photovoltaic Power Potential is the number of hours a day the Sun is shining enough to help your solar panels produce meaningful electricity for your home. Each location has a rating between 2 to 5.6 hours a day.
Use this Photovoltaic Power Potential Map to figure out what the value is for your area.
This article is owned by SolarPowerGenie.com and was first published on December 7, 2022

What is the typical solar panel output and dimensions
The typical residential solar panel output these days is between 250 to 400 watts per panel. Dimensions will vary a little from brand to brand but a good estimate is somewhere between 15 sq ft to 20 sq ft per panel depending output desired.
The typical length will be somewhere between 60 inches to 80 inches.
The typical width will be somewhere between 35 inches to 40 inches.
Average Cost of Solar Systems and Solar Incentives
| State | Starting cost for 6-kW system* | Average cost per watt** | 2022-2032 FED tax credit (30%)*** | 2033 FED tax credit (26%)*** |
| Alabama | $13,706 | $2.45 | $4,112 | $3,564 |
| Alaska | $13,454 | $2.41 | $4,036 | $3,498 |
| Arizona | $13,680 | $2.67 | $4,104 | $3,557 |
| Arkansas | $14,713 | $2.63 | $4,414 | $3,825 |
| California | $15,240 | $2.68 | $4,572 | $3,962 |
| Colorado | $17,100 | $2.44 | $5,130 | $4,446 |
| Connecticut | $15,540 | $2.86 | $4,662 | $4,040 |
| District of Columbia | $15,720 | $2.88 | $4,716 | $4,087 |
| Delaware | $15,300 | $2.65 | $4,590 | $3,978 |
| Florida | $13,920 | $2.41 | $4,176 | $3,619 |
| Georgia | $15,840 | $2.33 | $4,752 | $4,118 |
| Hawaii | $19,560 | $2.67 | $5,868 | $5,086 |
| Idaho | $17,100 | $2.52 | $5,130 | $4,446 |
| Illinois | $16,740 | $2.57 | $5,022 | $4,352 |
| Indiana | $15,300 | $2.49 | $4,590 | $3,978 |
| Iowa | $14,160 | $2.53 | $4,248 | $3,682 |
| Kansas | $13,353 | $2.39 | $4,006 | $3,472 |
| Kentucky | $13,101 | $2.34 | $3,930 | $3,406 |
| Louisiana | $15,660 | $2.38 | $4,698 | $4,072 |
| Maine | $16,073 | $2.87 | $4,822 | $4,179 |
| Maryland | $15,540 | $2.74 | $4,662 | $4,040 |
| Massachusetts | $16,440 | $2.87 | $4,932 | $4,274 |
| Michigan | $16,020 | $2.66 | $4,806 | $4,165 |
| Minnesota | $17,280 | $2.74 | $5,184 | $4,493 |
| Mississippi | $14,763 | $2.64 | $4,429 | $3,838 |
| Missouri | $14,461 | $2.59 | $4,338 | $3,760 |
| Montana | $16,560 | $2.42 | $4,968 | $4,306 |
| Nebraska | $15,820 | $2.83 | $4,746 | $4,113 |
| Nevada | $14,760 | $2.61 | $4,428 | $3,838 |
| New Hampshire | $17,460 | $2.83 | $5,238 | $4,540 |
| New Jersey | $14,520 | $2.77 | $4,356 | $3,775 |
| New Mexico | $16,680 | $2.44 | $5,004 | $4,337 |
| New York | $15,900 | $2.86 | $4,770 | $4,134 |
| North Carolina | $14,040 | $2.49 | $4,212 | $3,650 |
| North Dakota | $13,555 | $2.42 | $4,067 | $3,524 |
| Ohio | $14,400 | $2.50 | $4,320 | $3,744 |
| Oklahoma | $14,667 | $2.62 | $4,400 | $3,813 |
| Oregon | $15,060 | $2.50 | $4,518 | $3,916 |
| Pennsylvania | $15,420 | $2.38 | $4,626 | $4,009 |
| Rhode Island | $16,200 | $2.69 | $4,860 | $4,212 |
| South Carolina | $16,500 | $2.62 | $4,950 | $4,290 |
| South Dakota | $13,535 | $2.39 | $4,061 | $3,519 |
| Tennessee | $13,909 | $2.49 | $4,173 | $3,616 |
| Texas | $14,820 | $2.60 | $4,446 | $3,853 |
| Utah | $15,420 | $2.66 | $4,626 | $4,009 |
| Vermont | $16,620 | $2.85 | $4,986 | $4,321 |
| Virginia | $15,780 | $2.66 | $4,734 | $4,103 |
| Washington | $14,040 | $2.73 | $4,212 | $3,650 |
| West Virginia | $14,763 | $2.64 | $4,429 | $3,838 |
| Wisconsin | $17,580 | $2.60 | $5,274 | $4,571 |
| Wyoming | $14,360 | $2.57 | $4,308 | $3,734 |
* Before tax credits, according to EnergySage and Solar Reviews
** According to Solar Reviews
*** According to Energy.gov
Related Articles
What Roof Can Solar Panels Be Installed?
Where Should Solar Panels Face When Installed?
Reolink Solar Panel Not Charging
This article is owned by SolarPowerGenie.com and was first published on December 7, 2022